|
|
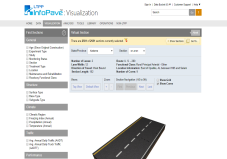
Transverse Profile Viewer
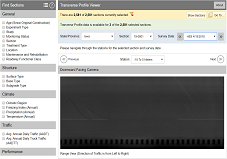
The LTPP Transverse Profile Viewer visualizes the images and data collected by the Transverse Profile Measurement System (TPMS) onboard the LTPP High-Speed Survey (HSS) vehicles. This type of laser-based surveys for the transverse profile measurement were initiated in the LTPP field operations in 2017 and therefore, the data and images are available for a subset of the LTPP test sections. The images and data are visualized for every 10 meters from the start point of the LTPP test section. The downward pavement images include Intensity and Range images: Intensity images show the intensity of the reflection of the laser device from each pixel, and the Range images show the depth of each pixel on a gray scale (deeper points are darker). The forward facing images show the right-of-way view of the test section. The transverse profile graph is based on data averaged over every 10 meters. The average normalized elevation data is based on the MON_T_PROF_ELEVATION table and the average rut depth data are based on the MON_T_PROF_INDEX_POINT table. Users can download all the images and save the graphs as images. All the data can be downloaded from the Data Selection and Download feature under Performance > Surface Characteristics > Transverse Profile (makes sure to check the Show Advanced Data Classification check box). Data can also be downloaded from the corresponding tables in the Table Export feature
Selected Section:State/Province:Section:Section Information:Downward Facing Camera
Forward Facing Camera
Transverse Profile
Download Profile Image Files
The complete set of downward and forward facing images (for the selected section and survey date) can be downloaded by clicking on the button below. |
 Data Selection and Download
 Explore Geospatial Analysis
 Section Summary Report
 Table Export
 Section Timeline
 Distress Maps and Images
 View Inspection Videos
 Data Pivot
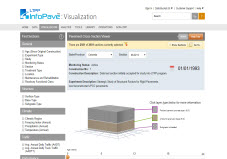
 Pavement Cross-Section Viewer
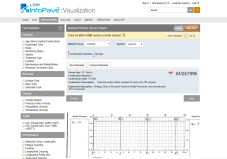
 Manual Distress Survey Viewer
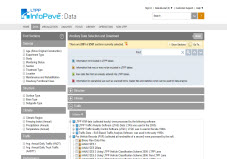
 Ancillary Data Selection
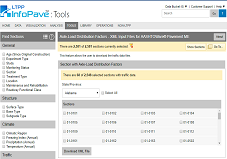
 Axle-Load Distribution Factors
 Transverse Profile Viewer
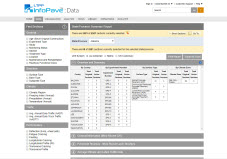
 State Summary Report
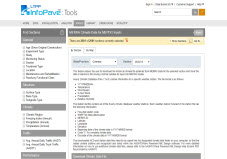
 MERRA Data for MEPDG Inputs
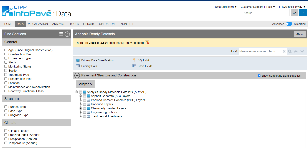
 Analysis Ready Datasets
 Correlation Analysis
 Data Availability
 Virtual Section
