


|
|
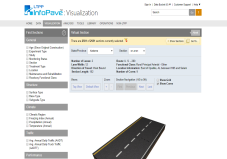
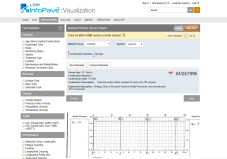
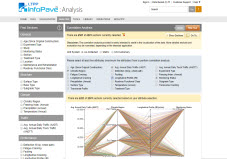
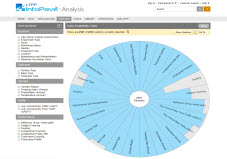
Trend Analysis
The Trend Analysis feature enables a user to visually analyze LTPP data by using different types of dynamically generated graphs and charts. The feature includes bar charts, scatter plots, time series, and multivariate trends for visualizing the desired data in selected test sections. Selecting the desired type of graph or chart displays data classification, data type, variables needed, and available attributes for visualization. The resulting graphs can be saved and exported for sharing with others.
Selected Section:State/Province:Section:Section Information:Disclaimer: The analytics provided are solely intended to assist in the visualization of the data. More detailed analysis and evaluation may be warranted, depending on the intended application.
Currently there are no attributes selected to draw the graph/chart. Currently there is no attribute selected to draw the graph/chart.
Select Country:
There is no section currently selected.
There are sections currently selected.

There is no section currently selected.
There are sections currently selected.
( - ) :
Bin Size:
|
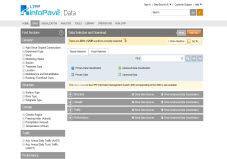
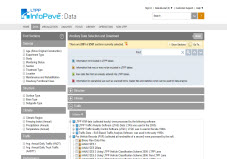
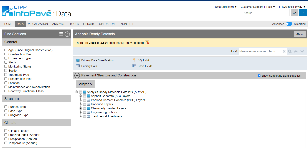
 Data Selection and Download
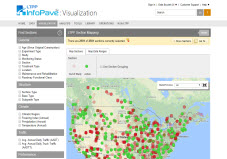
 Explore Geospatial Analysis
 Section Summary Report
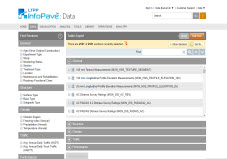
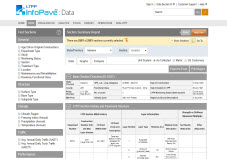 Table Export
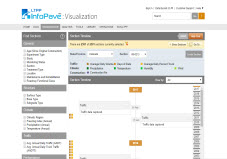
 Section Timeline
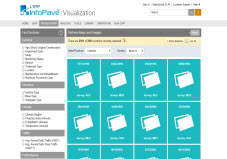
 Distress Maps and Images
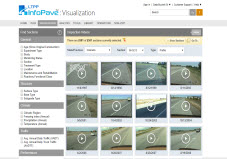
 View Inspection Videos
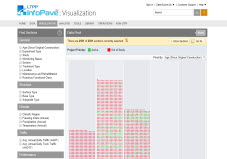
 Data Pivot
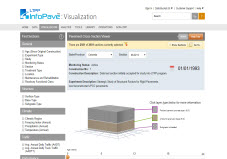
 Pavement Cross-Section Viewer
 Manual Distress Survey Viewer
 Ancillary Data Selection
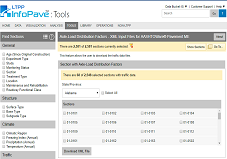
 Axle-Load Distribution Factors
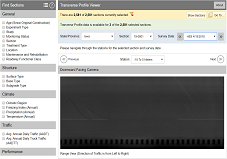
 Transverse Profile Viewer
 State Summary Report
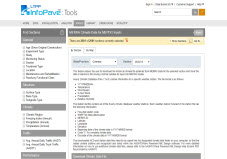
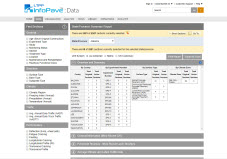 MERRA Data for MEPDG Inputs
 Analysis Ready Datasets
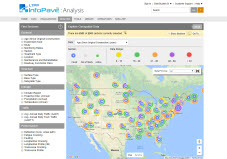
 Correlation Analysis
 Data Availability
 Virtual Section