


|
|
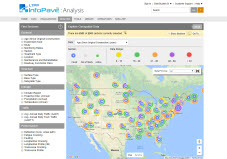
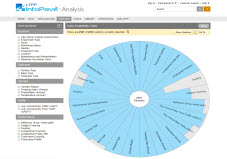
Data Availability Chart
This feature provides the ability for users to visualize the extent of LTPP data that is available for a given category such as Structure, Traffic, Climate, and Performance. The data presented is based on the selected filters and resultant test sections. For each category (piece of the pie), the results show the number of test sections that do contain this type of data as a fraction of all test sections selected using the filters in Find Sections (the length of the shading in a category). When hovering over each piece of the pie, the user will see a test section count, number of sections in each category or the average, minimum and maximum number of field visits available for each section. Not every element on the wheel applies to every test section. For the Experiment Type, Study, Treatment Type, Maintenance and Rehabilitation, and Surface Type categories, the summation of the available section counts from subcategories is greater than the total selected section count because the subcategories are not mutually exclusive. Some LTPP sections may belong to multiple subcategories over time (for instance when a GPS-1 experiment is overlaid it becomes a GPS-6) or even at the same time (for example, a section may belong to both GPS and SMP studies at the same time). Selected Section:State/Province:Section:Section Information: |
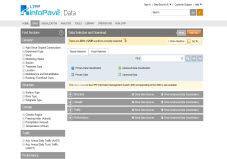
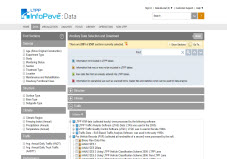
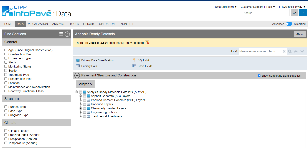
 Data Selection and Download
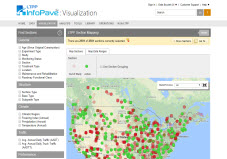
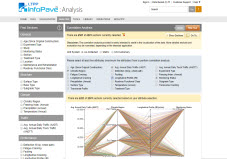
 Explore Geospatial Analysis
 Section Summary Report
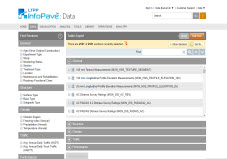
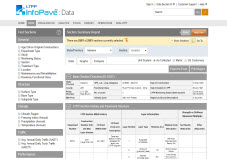 Table Export
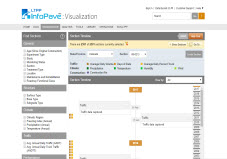
 Section Timeline
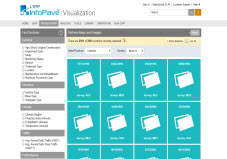
 Distress Maps and Images
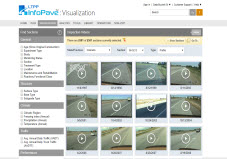
 View Inspection Videos
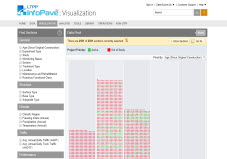
 Data Pivot
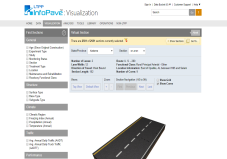
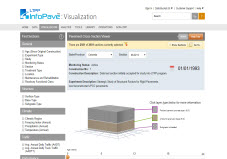
 Pavement Cross-Section Viewer
 Manual Distress Survey Viewer
 Ancillary Data Selection
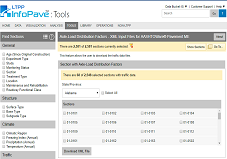
 Axle-Load Distribution Factors
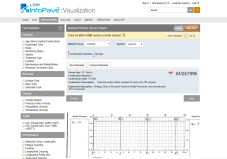
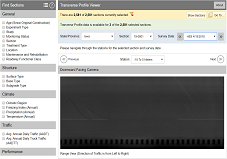
 Transverse Profile Viewer
 State Summary Report
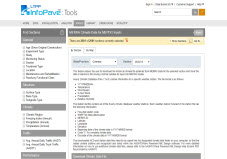
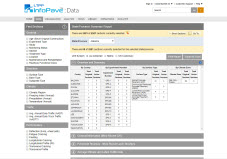 MERRA Data for MEPDG Inputs
 Analysis Ready Datasets
 Correlation Analysis
 Data Availability
 Virtual Section