


|
|
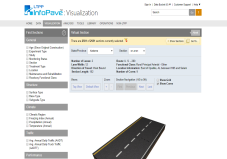
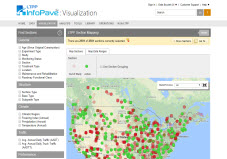
LTPP Section Mapping
LTPP Section Mapping displays selected LTPP pavement sections geographically on Google Maps under "Map Sections" tab for data presentations, analysis, and section detail information. Under "Map Data Ranges" tab, the selected data attributes associated with the LTPP sections are geographically displayed on Google Maps for data review, presentations, and analysis. The “Min/Max” radio button displays the minimum and maximum boundaries for selected data attribute, whereas “Data Distribution” radio button visually displays the breakdown of all data ranges for the selected attribute. The Data Distribution option also includes the previously available 'Explore Geospatial Data' functionality. It enables users to view data related to all available data attributes on Google Earth style maps. Data can also be exported in Keyhole Markup Language (KML) and geodatabase (GDB) formats. Selected Section:State/Province:Section:Section Information: |
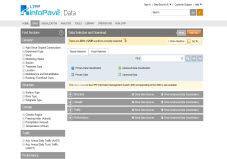
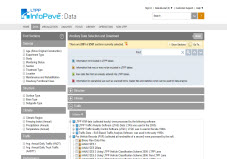
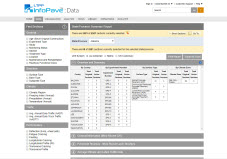
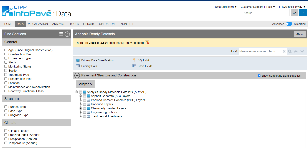
 Data Selection and Download
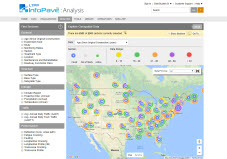
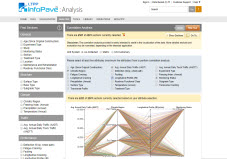
 Explore Geospatial Analysis
 Section Summary Report
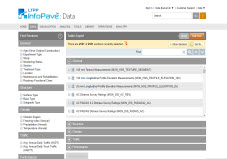
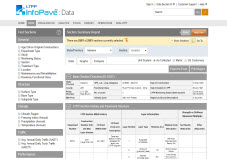 Table Export
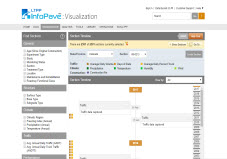
 Section Timeline
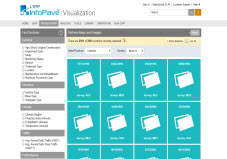
 Distress Maps and Images
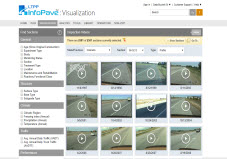
 View Inspection Videos
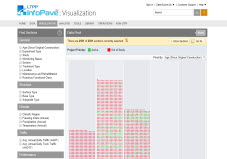
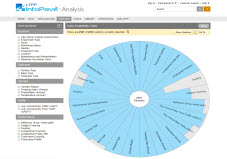
 Data Pivot
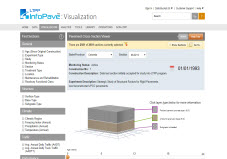
 Pavement Cross-Section Viewer
 Manual Distress Survey Viewer
 Ancillary Data Selection
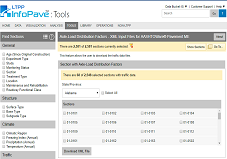
 Axle-Load Distribution Factors
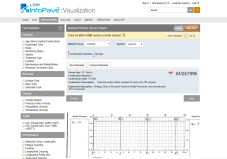
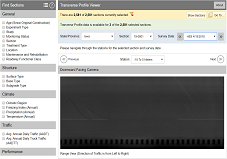
 Transverse Profile Viewer
 State Summary Report
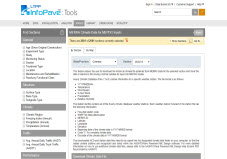
 MERRA Data for MEPDG Inputs
 Analysis Ready Datasets
 Correlation Analysis
 Data Availability
 Virtual Section